
如何将好几张功能富集结果中的柱状图的横坐标的范围全部调整为一样的?
一般画这个柱状图都是用Y叔的clusterprofiler包中的barplot函数对使用这个包的功能富集结果进行一键绘图,超级简单方便。但是当我去查找这个函数的调整坐标的参数时:
Usage
## S3 method for class ‘enrichResult’
barplot(height, x = “Count”, colorBy = “pvalue”,
showCategory = 5, font.size = 12, title = “”, …)
Arguments
height enrichResult object
x one of ‘Count’ and ‘GeneRatio’
colorBy one of ‘pvalue’, ‘p.adjust’, ‘qvalue’
showCategory number of categories to show
font.size font size
title plot title
… other parameter, ignored
other parameter, ignored,other parameter, ignored,other parameter, ignored……
也就是说这个函数里面没有调整坐标范围的参数,不知道是不是因为我没找到还是什么,反正我找了好久没有找到,我有点方。
后面我觉得还是自己用ggplot2画吧,反正这个包里面一键绘图也是根据ggplot2来的。
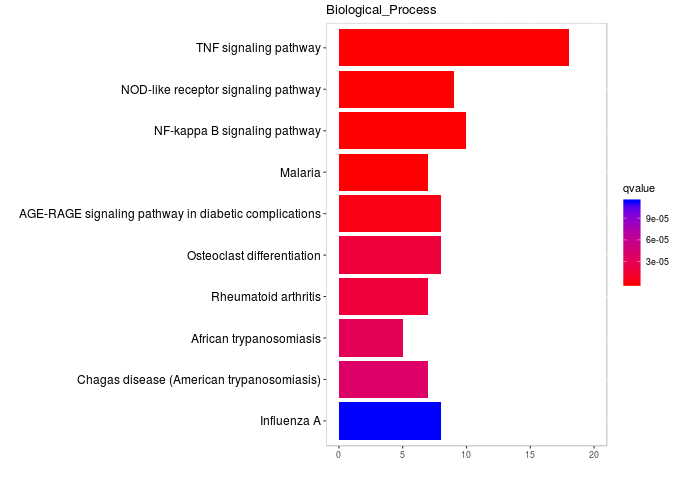
这个图与一般的函数barplot画出来的不一样的地方在于它的颜色,这张图里面的颜色反应的是fdr的大小,是一个连续值,ggplot2可以将连续值映射到到颜色上,横坐标是通路中感兴趣基因的个数。
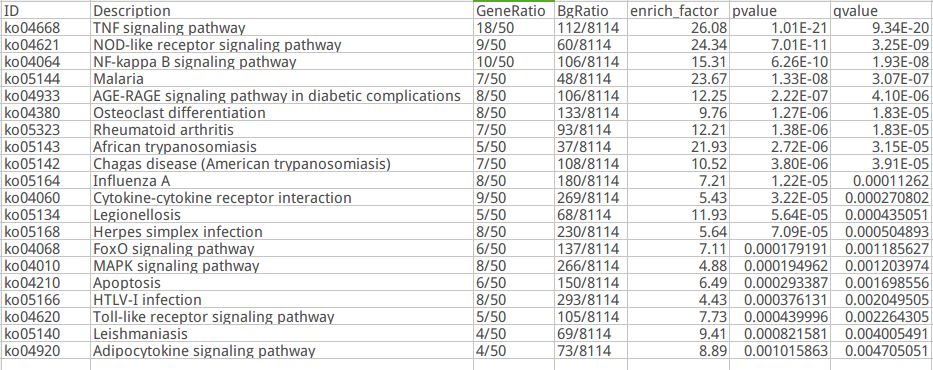
用来画图的数据示例:
#加载ggplot2包
library(ggplot2)
#一键清除
rm(list=ls())
#设置文件路径
setwd(“D:/zhangj/DZH/enrichment”)
#读取功能富集结
enrich <- read.table(“S01_S03_S05_vs_S02_S04_S06_Biological_Process_enrich.list”, header=T,sep=”\t”,stringsAsFactors=F,comment.char=””,quote=”\””)
#对富集结果按照qvalue进行从小到大排序,保证最显著的通路在前
enrich1 <- enrich[order(enrich$qvalue),]
#这里画图只展示top10的通路
enrich2 <- enrich1[1:10,]
#提取每条通路里面差异表达的基因数
count <- as.numeric(unlist(strsplit(enrich2$GeneRatio,”/5498″,fixed=T)))
enrich3 <- data.frame(enrich2[,2],count,enrich2[,7])
colnames(enrich3) <- c(“ID”,”count”,”qvalue”)
#fill=qvalue fill颜色填充,使用连续值qvalue
p <- ggplot(data=enrich3,aes(x=ID,y=count,fill=qvalue))
#coord_flip()颠倒坐标轴
p1 <- p + geom_bar(stat=”identity”) + coord_flip()
p2 <- p1 + theme(panel.background=element_rect(fill=’transparent’,color=’gray’),
axis.text.y=element_text(color=”black”,size=12))
#ylim(0,20) 更改横坐标的范围这里坐标轴颠倒了,虽然看起来是x轴,但其实是y轴
p3 <- p2 + ylim(0,20) + scale_fill_gradient(low=”red”,high=”blue”)
p4 <- p3 + scale_x_discrete(limits=rev(enrich3[,1])) +labs(x=””,y=””,title=”Biological_Process”)
#输出为png格式的图片
png(“S01_S03_S05_vs_S02_S04_S06_Biological_Process_enrich.png”,width=680,height=480)
print(p4)
dev.off()
#输出为pdf的文件
pdf(“S01_S03_S05_vs_S02_S04_S06_Biological_Process_enrich.pdf”,width=9)
print(p4)
dev.off()
最后结果图:


 京公网安备 11011302003368号