
数据相关统计
表1 测序Reads统计
| Type | Number | Percent(%) |
|---|---|---|
| Number of Reads | 1,338,426,735 | |
| Valid Barcodes | 1,262,816,067 | 94.35 |
| Valid UMIs | 1,329,064,839 | 99.3 |
| Final Valid Reads | 1,262,615,019 | 94.34 |
▶表1 note说明
Number of Reads:Reads总数;
Valid Barcodes:包含有效Barcode的Reads数;
Valid UMIs:包含有效UMIs的Reads数;
Final Valid Reads:同时包含有效barcode与UMI的最终Reads数。
表2 数据比对
| Type | Percent(%) |
|---|---|
| Reads Mapped to Genome | 97.63% |
| Reads Mapped Confidently to Genome | 91.24% |
| Reads Mapped Confidently to Intergenic Regions | 5.49% |
| Reads Mapped Confidently to Intronic Regions | 6.09% |
| Reads Mapped Confidently to Exonic Regions | 79.66% |
| Reads Mapped Confidently to Transcriptome | 81.42% |
▶表2 note说明
Reads Mapped to Genomes:比对到参考基因组上的Reads在总Reads中占的比例;
Reads Mapped Confidently to Genome:比对到参考基因组并得到转录本GTF信息支持的Reads在总Reads中占的比例;
Reads Mapped Confidently to Intergenic Regions:比对到基因间区域的Reads在总Reads中占的比例;
Reads Mapped Confidently to Intronic Regions:比对到内含子区域的Reads在总Reads中占的比例;
Reads Mapped Confidently to Exonic Regions:比对到外显子区域的Reads在总Reads中占的比例;
Reads Mapped Confidently to Transcriptome:比对到已知参考转录本的Reads在总Reads中占的比例。
Spots相关统计
Summary
表3 Spots统计
| Tpyes | Values |
|---|---|
| Sequencing Saturation | 88.33% |
| Percent of Spots Under Tissue | 39.00% |
| Fraction Reads in Spots Under Tissue | 85.71% |
▶表3 note说明
Sequencing Saturation:测序饱和度;
Percent of Spots Under Tissue:切片组织下Spots的比例;
Fraction Reads in Spots Under Tissue:切片组织下Reads的比例。
表4 不同水平Spots统计
| Level | 13 (100μm) | 7 (50μm) | 6 (42μm) | 5 (35μm) | 4 (27μm) | 3 (20μm) | 2(10μm) | 1 (5μm) |
|---|---|---|---|---|---|---|---|---|
| Number of SupSpots | 1,991 | 7,357 | 10,263 | 15,315 | 25,227 | 49,148 | 133,376 | 724,620 |
| Median Genes per SupSpot | 8,787 | 4,377 | 3,566 | 2,740 | 1,929 | 1,160 | 498 | 106 |
| Median UMI Counts per SupSpot | 46,584 | 12,475 | 8,975 | 6,021 | 3,642 | 1,840 | 655 | 120 |
| Total Genes Detected | 37,427 | 37,421 | 37,419 | 37,423 | 37,422 | 37,419 | 37,422 | 37,423 |
▶表4 note说明
Level:分辨率水平;
Number of SupSpots:一个或多个spot合并成的supspot个数;
Median Genes per SupSpot:每个SupSpot中基因数目的中位数;
Median UMI Counts per SupSpot:每个SupSpot的UMI中位数;
Total Genes Detected:基因总数。
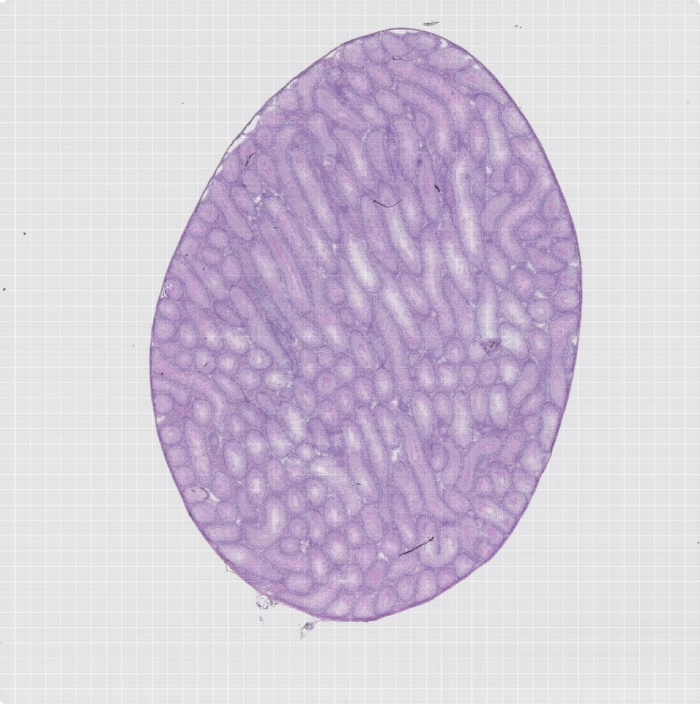
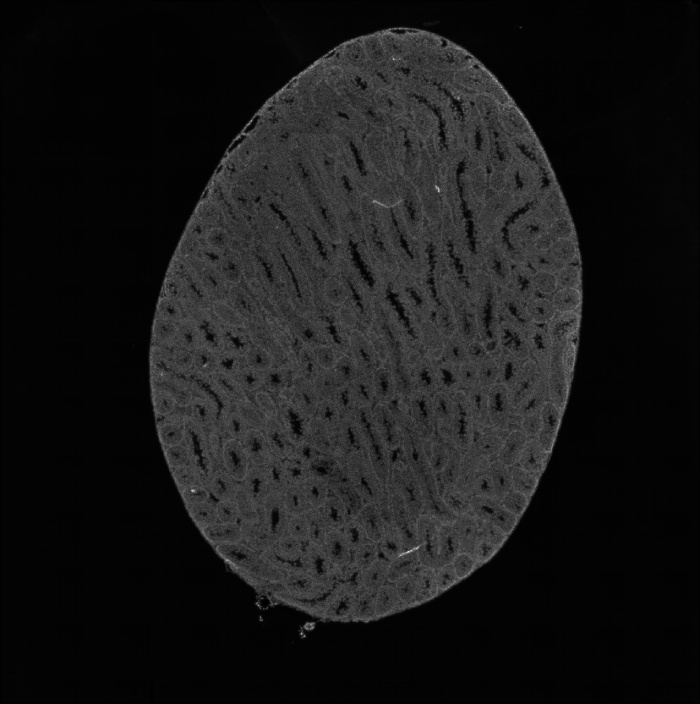
组织切片HE染色图
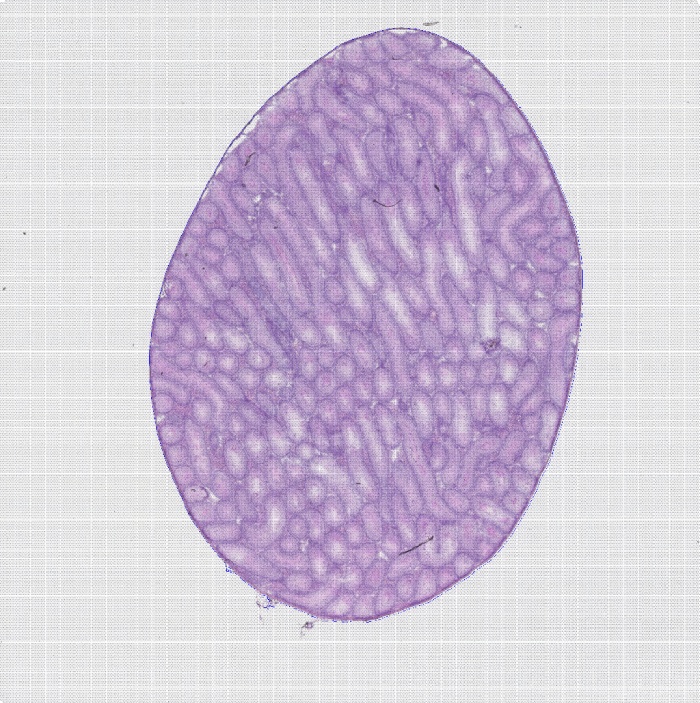
图1 组织切片HE染色图
组织umi-count统计图
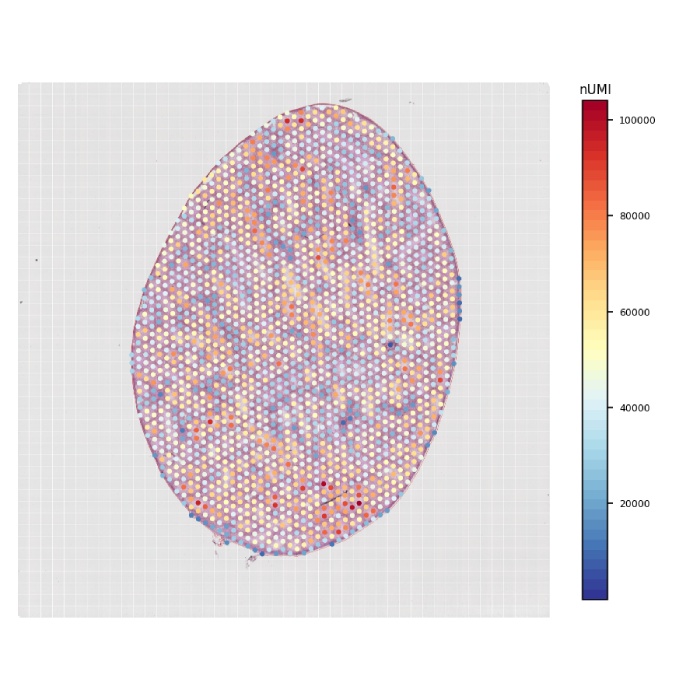
图2 组织UMI count统计图
▶分辨率水平说明
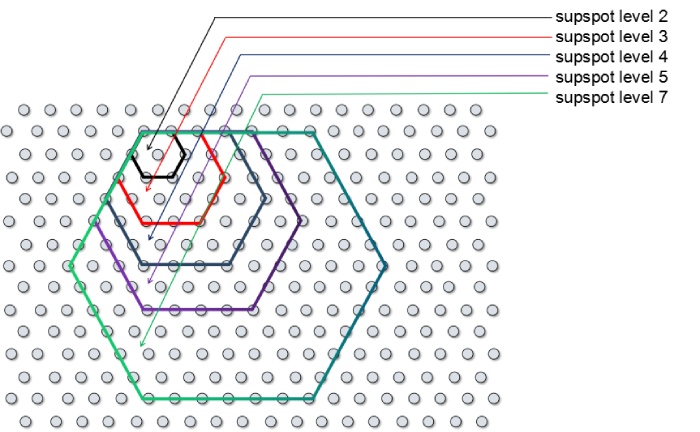
supspot level与spot点数图
supspot level分辨率表
| SupSpot Level | 分辨率 | Spot点数 |
|---|---|---|
| 13 | 100μm | 469 |
| 7 | 50μm | 127 |
| 6 | 42μm | 91 |
| 5 | 35μm | 61 |
| 4 | 27μm | 37 |
| 3 | 20μm | 19 |
| 2 | 10μm | 7 |
| 1 | 5μm | 1 |
聚类分析
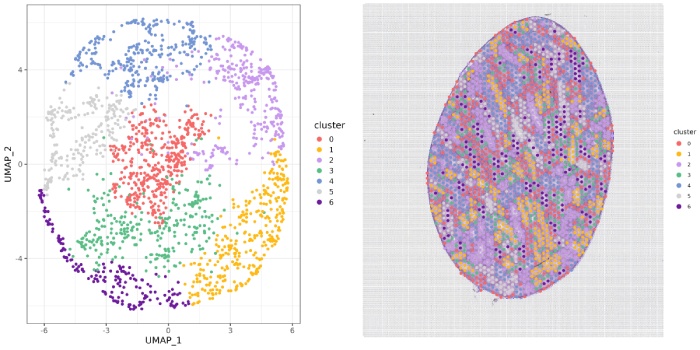
l13-cluster聚类图
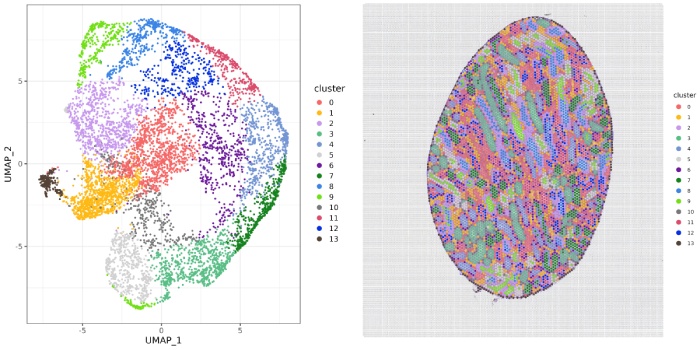
l7-cluster聚类图
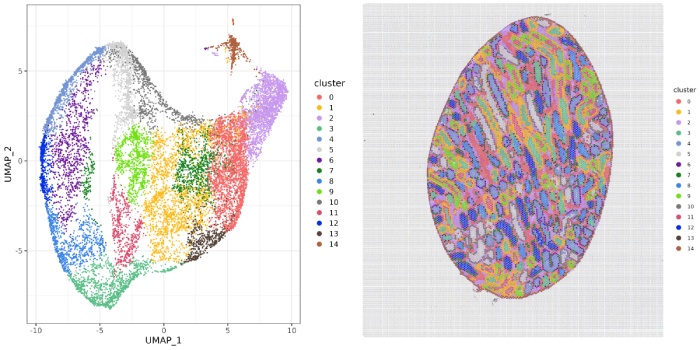
l5-cluster聚类图
细胞分割
Summary
表5 细胞分割统计
| Type | Value |
|---|---|
| Number of Cells | 137,671 |
| Median Genes per Cells | 645 |
| Median UMI Counts per Cells | 870 |
| Total Genes Detected | 37,319 |
▶表5 note说明
Number of Cells:分割得到的细胞数;
Median Genes per Cells:每个细胞中基因数目的中位数;
Median UMI Counts per Cells:细胞的UMI中位数;
Total Genes Detected:基因总数。
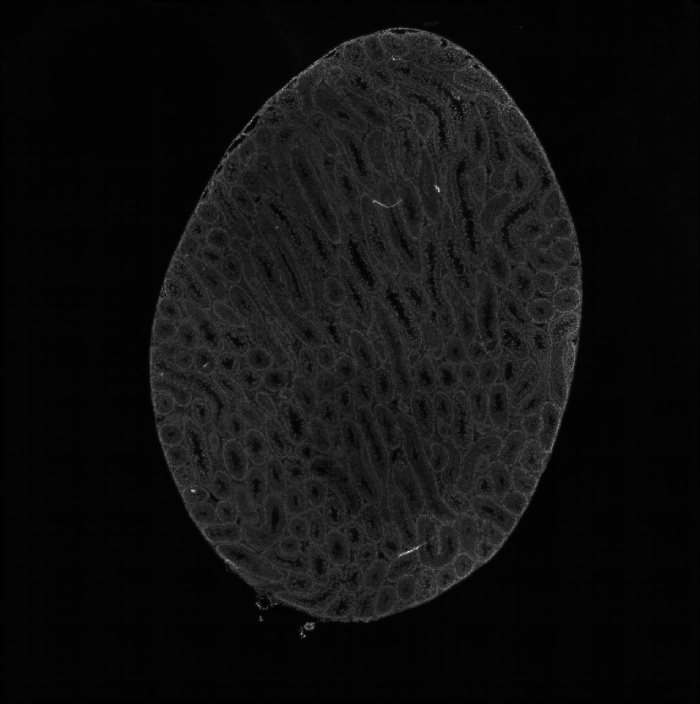
组织切片荧光图
组织切片he分割图
组织切片荧光分割图
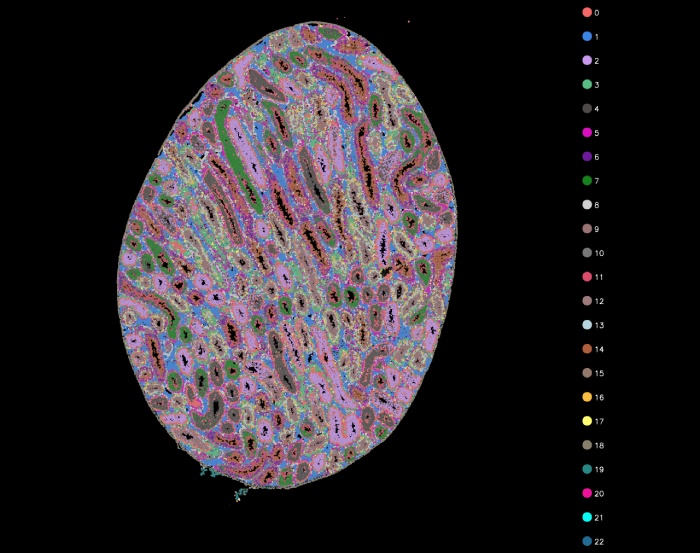
细胞分割聚类图


 京公网安备 11011302003368号